Appearance
Dashboard
The Dashboard is your central hub for monitoring AI assistant performance, tracking usage, and understanding how users interact with your Agentic AI assistants.
Overview
When you log into FineGuide AI, the Dashboard provides an immediate snapshot of:
- Conversation activity across all your assistants
- Lead generation progress
- Ticket status and pending items
- Usage metrics for your subscription
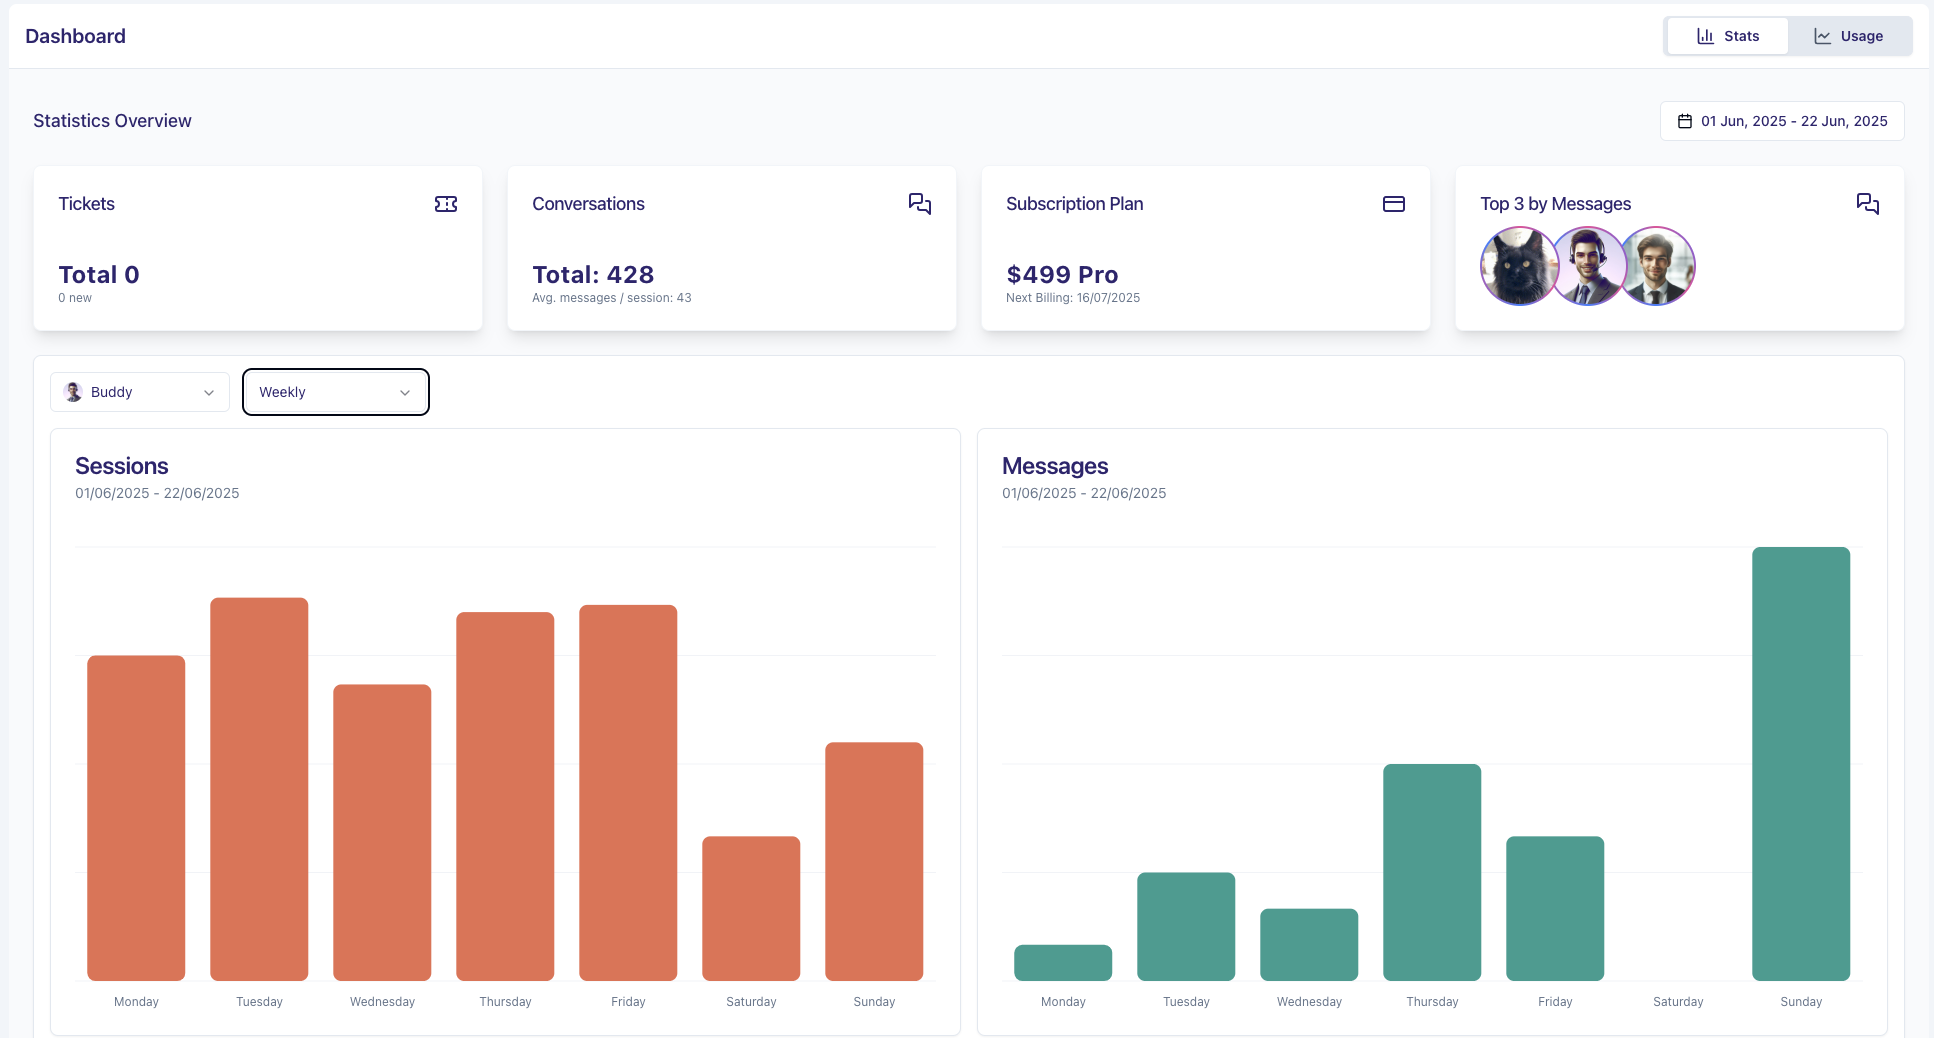
Stats Tab
The Stats tab displays real-time performance metrics for your assistants.
Setting Your Date Range
To analyze data from a specific time period:
- Click the date range selector in the top-right corner
- Select your start and end dates from the calendar
- Click Apply to update all metrics
The dashboard defaults to your current billing cycle, but you can select any custom range.
Summary Cards
At the top of the Stats tab, you'll find quick-glance cards:
| Card | What It Shows |
|---|---|
| Tickets | Total tickets and new tickets needing attention. Click to go to Tickets. |
| Conversations | Total conversation count and average messages per session |
| Subscription | Current plan details and renewal date. Click for billing info. |
| Top Agents | Most active assistants by conversation volume |
Agent Activity Patterns
The activity charts show when users engage with your assistants:
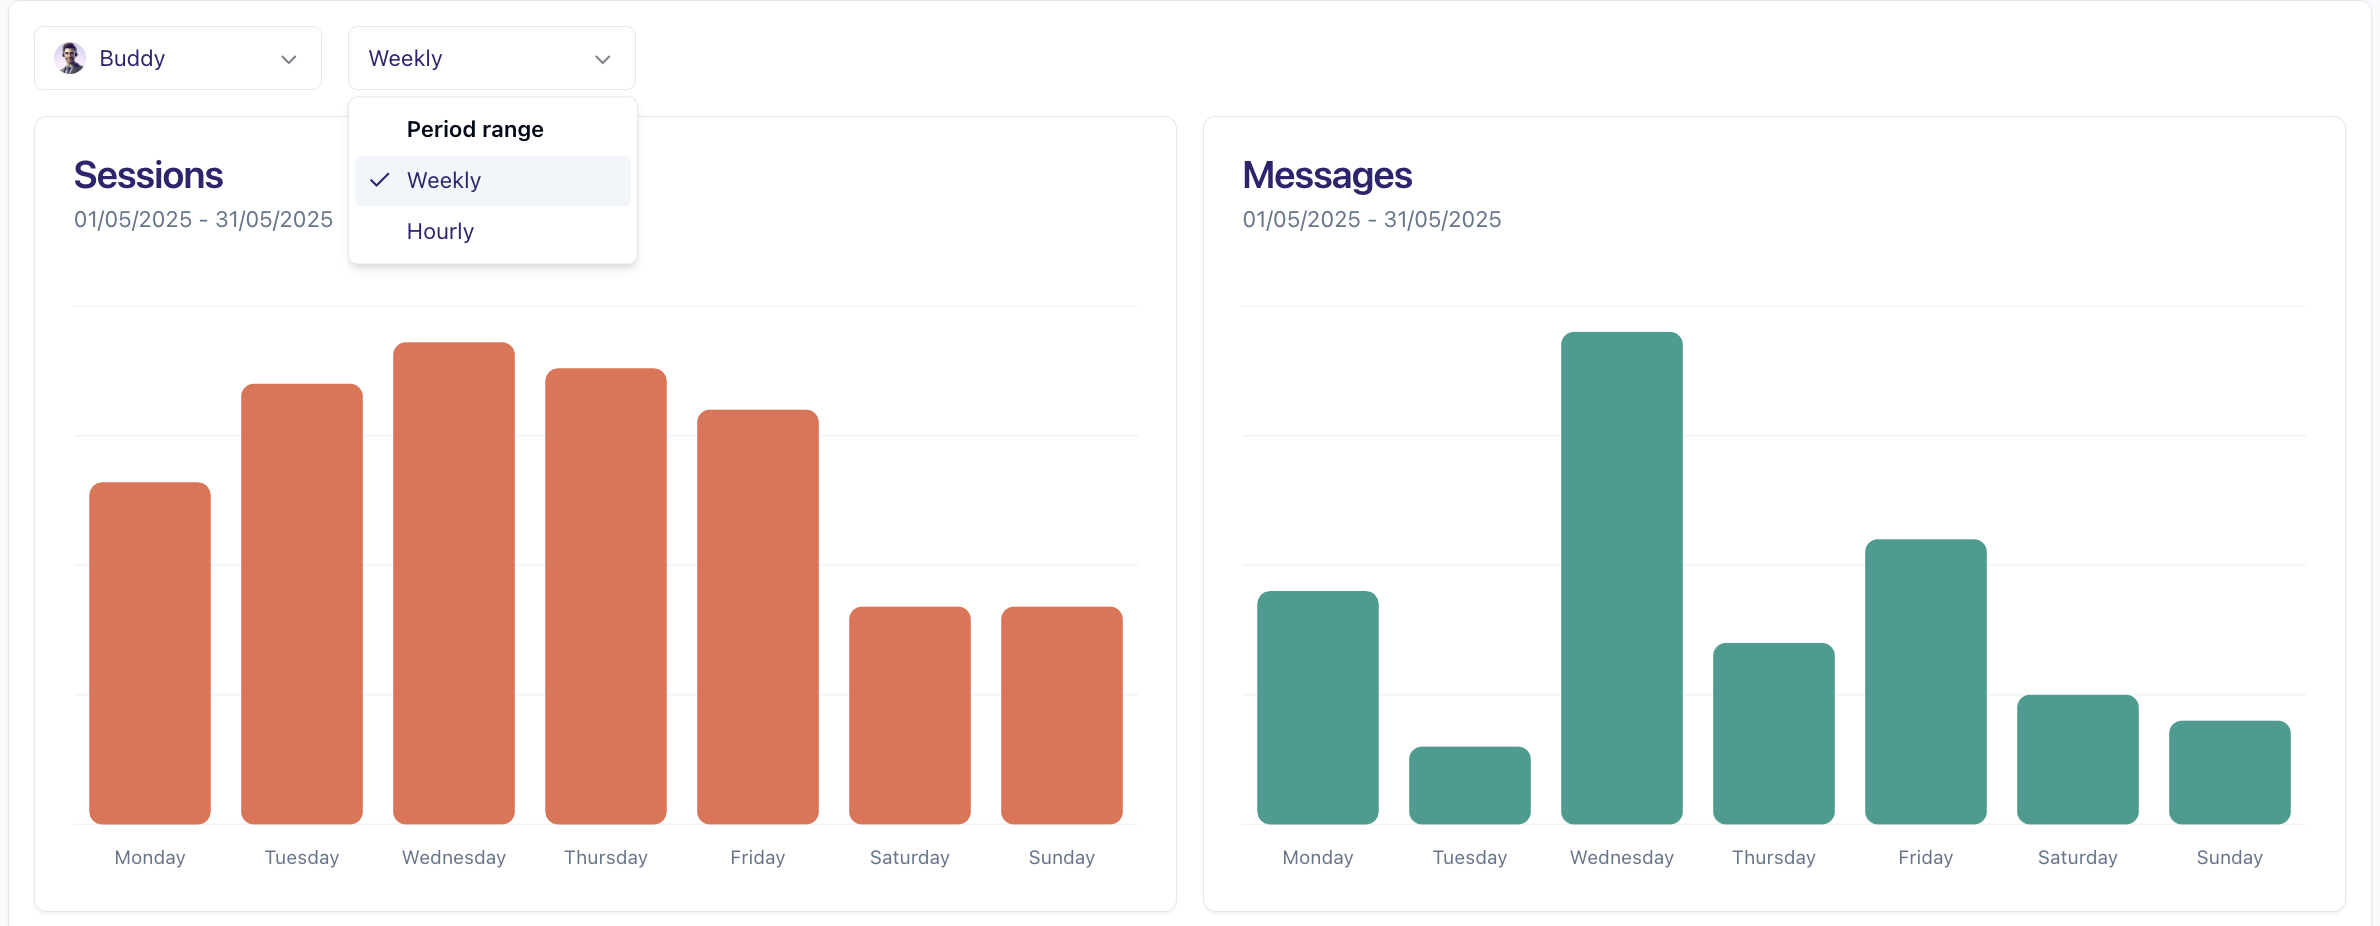
Two views available:
- Weekly View — Shows which days have highest activity (weekday vs. weekend trends)
- Hourly View — Shows peak usage times throughout the day
To analyze a specific assistant:
- Use the agent dropdown selector
- Select the assistant you want to analyze
- Charts update automatically for that assistant
Understanding the metrics:
- Messages — Individual messages exchanged
- Sessions — Complete conversations from start to finish
- Leads — Contact information captured during conversations
Leads Overview
The Leads section shows lead generation performance:
- Total Leads Counter — Leads generated during selected period
- Lead Chart — Visual trend of lead generation over time
- Per-Agent Analysis — Filter by assistant to see individual performance
Credits Overview
The Dashboard provides a quick view of your credit consumption.
Simple Pricing
FineGuide uses predictable, straightforward pricing:
- AI Assistant Messages — 1 credit per message
- Voice QA Analysis — 12 credits per minute
Our agentic AI system automatically orchestrates multiple models behind the scenes, so you don't need to worry about model selection.
Checking Detailed Usage
For comprehensive usage tracking and billing management, navigate to the Billing page in your organization settings. There you can view:
- Detailed credit consumption history
- Subscription status and limits
- Extra usage charges
- Payment methods and invoices
Managing Your Knowledge Base
Context Usage shows storage space used for your knowledge base:
- If approaching storage limits, review and remove outdated documents
- Consolidate similar content to reduce duplication
- Remove unused website crawls
Agent Performance Analysis

Top Usage by Agent
The "Top Usage by Agent" chart ranks assistants by conversation volume, helping you:
- Identify most active assistants handling the highest load
- Spot underutilized assistants that may need promotion
- Balance workloads by adjusting routing or content
- Make data-driven decisions about which assistants to optimize
Performance Insights
When an assistant shows lower performance:
- Click the assistant name to go to its configuration
- Review the knowledge base for gaps
- Check response settings match user expectations
- Analyze conversation history for common failure points
Lead Conversion Tracking
Track how effectively assistants convert conversations to leads:
- Compare conversion rates across different assistants
- Healthy conversion rates typically range 5-15% depending on industry
- Investigate sudden drops by checking recent configuration changes
Tips for Using the Dashboard
Daily Monitoring
- Check the summary cards for any anomalies
- Review new tickets that need attention
- Monitor lead generation trends
Weekly Review
- Analyze activity patterns to identify peak times
- Compare assistant performance
- Check billing page to monitor credit consumption
Monthly Analysis
- Export usage data for reporting
- Evaluate ROI of different assistants
- Plan capacity based on growth trends